Our team has developed an automated model capable of identifying multiple end-systolic and end-diastolic frames in echocardiographic videos of arbitrary length with performance indistinguishable from that of human experts, but with significantly shorter processing time.
Dataset
We used 3 datasets in this study: 1 for training & testing, the others for testing only. We have made our patient dataset and models publicly available, thereby providing a benchmark for future studies and allowing for external validation of our approach
Additionally, we used annotations (ground-truth) from several cardiologist experts, allowing for the examination of inter- and intra-observer variability
A summary of the datasets is as follows:
Name |
PACS-dataset |
MultiBeat-dataset |
EchoNet-dataset |
|---|---|---|---|
| Source | Made public for this study NHS Trust PACS Archives, Imperial College Healthcare |
Private St Mary’s Hospital |
Public Stanford University Hospital echonet.github.io/dynamic |
| Ultrasound machine | Philips Healthcare (iE33 xMATRIX) | GE Healthcare (Vivid.i) and Philips Healthcare (iE33 xMATRIX) | Siemens Healthineers (Acuson SC2000) and Philips Healthcare (iE33, Epiq 5G, Epiq 7C) |
| Number of videos/patients | 1,000 | 40 | 10,030 |
| Length of videos | 1-3 heartbeats | ≥ 10 heartbeats | 1 heartbeat |
| Ground-truth | 2 annotations by 2 experts | 6 annotations by 5 experts (twice by one expert) | 1 annotation |
| Original size (pixels) | (300-768)×(400-1024) | 422×636 | 112×112 |
| Frame rate (fps) | 23-102 | 52-80 | 50 |
| Format | DICOM | DICOM | AVI |
| Use | Training/Testing | Testing | Testing |
Network Architecture
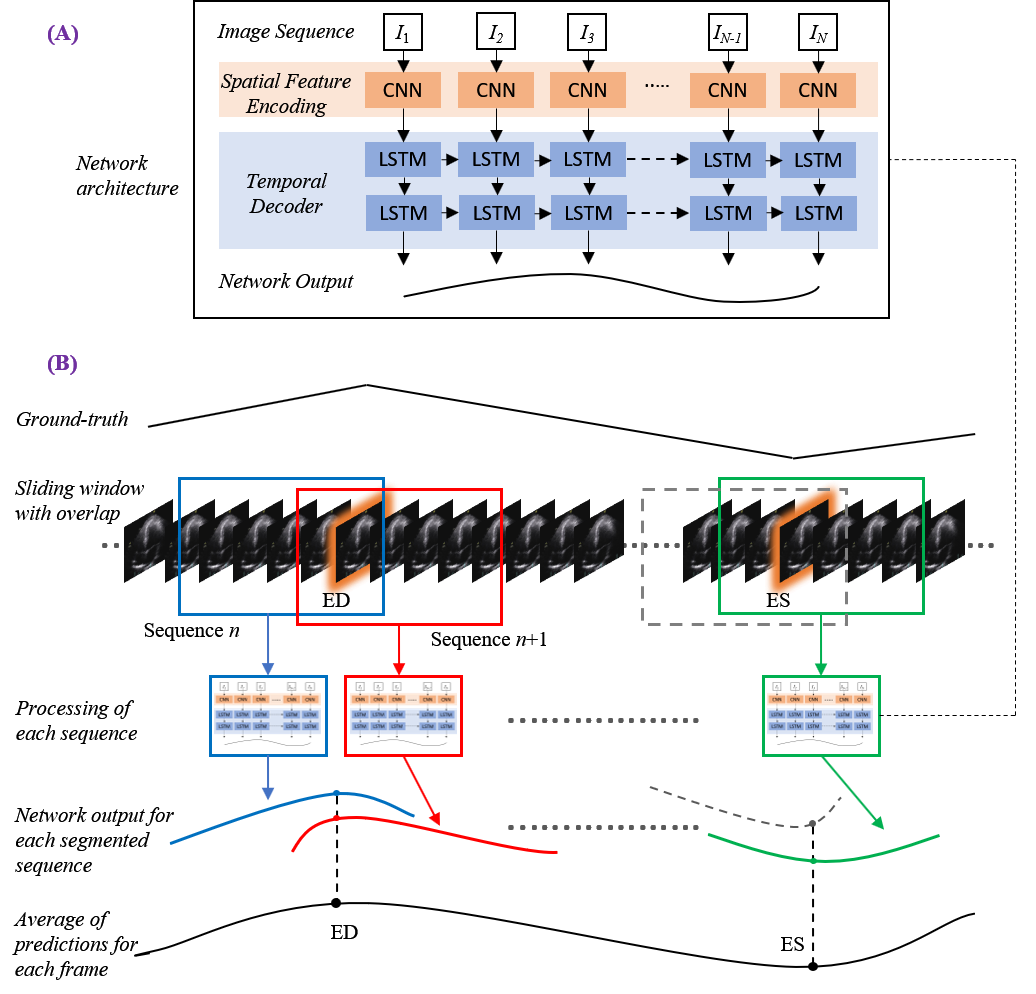
Considering the patient image sequences as visual time-series, we adopted Long-term Recurrent Convolutional Networks (CNN+LSTM) for analysing the echocardiographic videos.
Such architectures are a class of models that is both spatially and temporally deep, specifically designed for sequence prediction problems (e.g., order of images) with spatial inputs (e.g. 2D structure or pixels in an image).
The figure to the right provides an overview of the network architecture.
The model comprises:
(i) CNN unit: for the encoding of spatial information for each frame of an echocardiographic video input
(ii) LSTM units: for the decoding of complex temporal information
(iii) a regression unit: for the prediction of the frames of interest.
Spatial feature extraction: First, a CNN unit is used to extract a spatial feature vector from every cardiac frame in the image sequence. A series of state-of-the-art architectures were employed for the CNN unit. These included ResNet50, InceptionV3, DenseNet, and InceptionResNetV2.
Temporal feature extraction: The CNN unit above is only capable of handling a single image, transforming it from input pixels into an internal matrix or vector representation. LSTM units are therefore used to process the image features extracted from the entire image sequence by the CNN, i.e. interpreting the features across time steps. Stacks of LSTM units (1-layer to 4-layers) were explored, where the output of each LSTM unit not in the final layer is treated as input to a unit in the next.
Regression unit: Finally, the output of the LSTM unit is regressed to predict the location of ED and ES frames. The model returns a prediction for each frame in the cardiac sequence (timestep).
Implementation
The models were implemented using the TensorFlow 2.0 deep learning framework and trained using an NVIDIA GeForce ® GTX 1080 Ti GPU.
Random, on the fly augmentation prevented overfitting, such as rotating between -10 and 10 degrees and spatial cropping between 0 and 10 pixels along each axis.
Throughout the study, training was conducted over 70 epochs with a batch size of 2 for all models. The PACS-dataset was used to train the models, with a data split of 60%, 20% and 20% for training, validation and testing, respectively.
During testing, a sliding window of 30 frames in width with a stride of one was applied, allowing up to 30 predictions of differing temporal importance to be calculated for each timestep. Toward the end of each video, should a segment be fewer than 30 frames in length, it was zero-padded with the added frames removed after completion. Experimentation proved a stack of 2 LSTM layers was the optimum configuration across all models.
Evaluation metrics
As the primary endpoint for frame detection, evaluation of trained network predictions measures the difference between each labelled target, either ED or ES, and the timestep prediction.
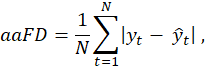
Average Absolute Frame Difference (aaFD) notation is applied (to the left), where N is the number of events within the test dataset.
The signed mean (μ) and standard deviation (σ) of the error (i.e. frame differences) were also calculated.
Results
PACS-dataset:
The average time (mean±SD) taken by the operators to manually annotate ED/ES frames was 26±11 seconds, per event. The equivalent time for our automated models, executed on the GPU, was less than 1.5 seconds; significantly faster than the human-led process.
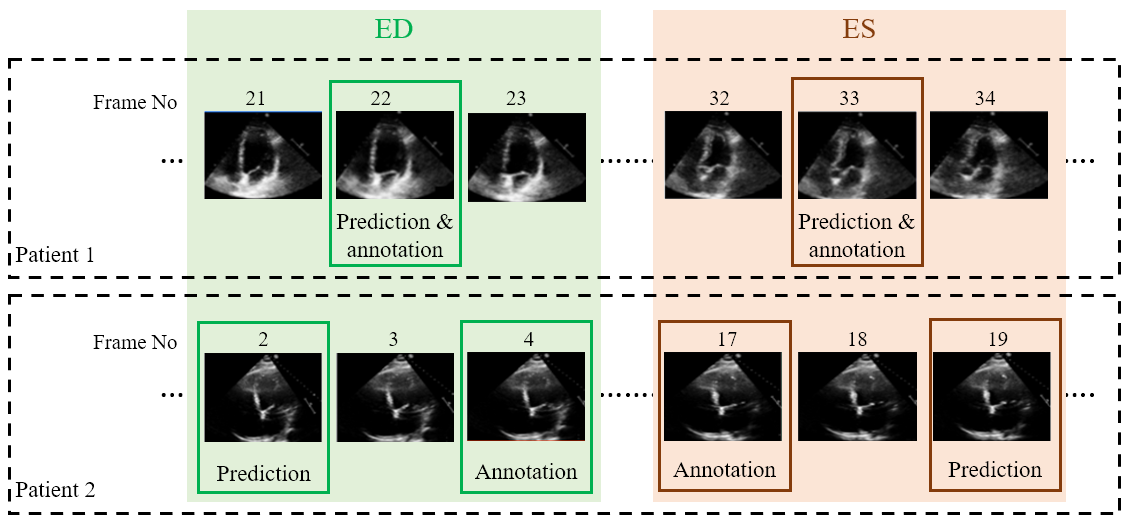
Examples of two random patient videos for which the frame detection error is zero, as well as when there is a disagreement between the model’s predictions and expert annotations can be seen to the right.
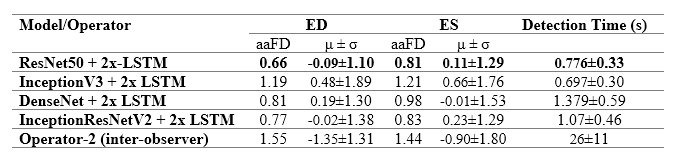
The table to the left details the error in ED and ES frame detection for all videos in the PACS-dataset. The results indicate the level of disagreement between Operator-1 annotations, considered as the ground-truth, compared with automated predictions and those made by Operator-2.
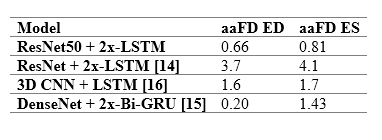
The table to the right provides a comparison between the performance of the model and previously reported deep learning results. The model outperforms almost all existing approaches, indicating smaller discrepancies with the ground-truth from which it has learnt. However, caution is necessary, as different studies have used different private patient datasets, presumably with various levels of image quality and experience of human experts for annotations. Therefore, a direct comparison between the reported accuracies may not be as informative as desired. However, the proposed model’s removal of all pre-processing steps and its capacity to identify multiple heartbeats in one long video is an indisputable advantage.
For details about the comparable studies, please see the references in our published paper
Multibeat-dataset:
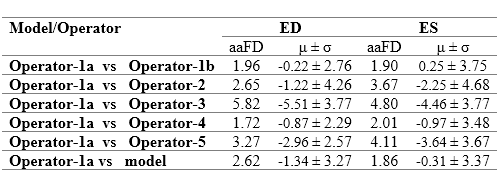
The Multibeat dataset was annotated by 5 experts, one of whom annotated twice for the evaluation of intra-observer variability. We refer to Operator-1a as the first set of annotations, and Opoerator-1b as the second set of annotations by the same expert
The table to the right details detection errors between Operator-1 and detections made by the model and other operators. The model disagrees with Operator-1, as do Operators 2-5. Indeed, Operator-1 disagreed with themselves on their second annotation attempt. The smallest error was the discrepancy between the two annotations on separate occasions by the same operator (i.e. intra-observer variability), with a mean difference -0.22±2.76 and 0.25±3.75 for ED and ES events, respectively.
The range of mean difference between two different operators (i.e. inter-observer variability) was [-0.87, -5.51]±[2.29, 4.26] and [-0.97, -3.46]±[3.67, 4.68] for ED and ES events, respectively. The model discrepancy falls within the range of inter-observer variability. Clearly demonstrating the reliability of the model in frame detection, compared with the experienced human experts.
EchoNet-dataset:
Previously, the proposed model was compared against alternative reported approaches. However, each study used a different private dataset, making a direct comparison extremely difficult. Here, we applied our model to the publicly available EchoNet-dataset, allowing for future studies to be benchmarked against ours. Like the MultiBeat-dataset, no further training was carried out, and the dataset was used in its entirety for testing. From the total number of videos (10,000), 810 were excluded owing to one of the ED or ES events occurring in the penultimate or final frame in the video, hence being unsuitable. EchoNet was made available for a challenge focused on segmentation of the left ventricular. Therefore, it was acceptable to have ED or ES events occurring in first or last frames. The retained 9,190 videos were fed into the model, when no resampling of the images was required as the dataset is provided with a resolution of 112×112 pixels; identical to the input size of our model. An aaFD of 2.30 and 3.49 frames was obtained for ES and ES events, respectively and the mean frame difference was 0.16±3.56 and 2.64±3.59 for ED and ES; well within the range of inter-observer variability already observed.
If you have any questions about this work, please email Elisabeth.Lane@uwl.ac.uk
Request Access to the project dataset
We have made the PACS-dataset used for training and testing our multibeat phase detection model public for the purpose of benchmarking against future studies.
If you would like to request access to the PACS-dataset, please complete the form below.
Please note that the EchoNet dataset used for testing only in this study is available at the following URL: https://echonet.github.io/dynamic/
Important information about the PACS-dataset:
We took a large random sample of echocardiographic studies from different patients performed between 2010 and 2020 from Imperial College Healthcare NHS Trust’s echocardiogram database. Ethical approval was obtained from the Health Regulatory Agency for the anonymised export of large quantities of imaging data. It was not necessary to approach patients individually for consent of data originally acquired for clinical purposes.
The images were acquired during examinations performed by experienced echocardiographers, according to the standard protocols for using ultrasound equipment from GE and Philips manufacturers. Only studies with full patient demographic data, and without intravenous contrast administration, were included. Automated anonymisation was performed to remove the patient-identifiable information.
A CNN model, previously developed in our research group to detect different echocardiographic views, was then used to identify and separate the A4C views. A total of 1,000 videos from different patients of varying lengths, were randomly selected.
Two accredited and experienced cardiology experts manually selected ED and ES frames, each blinded to the judgment of the other. We developed a custom-made program closely replicating the interface of clinical echocardiography hardware. Operators visually inspected the cine loops by controlled animation using a trackball, or arrow keys. The operators were asked to pick ED and ES frames in the A4C view, as they would in preparation for a Biplane Simpson’s measurement in clinical practice. All image sequences were down sampled by cubic interpolation into a standardised size of 112×112 pixels.
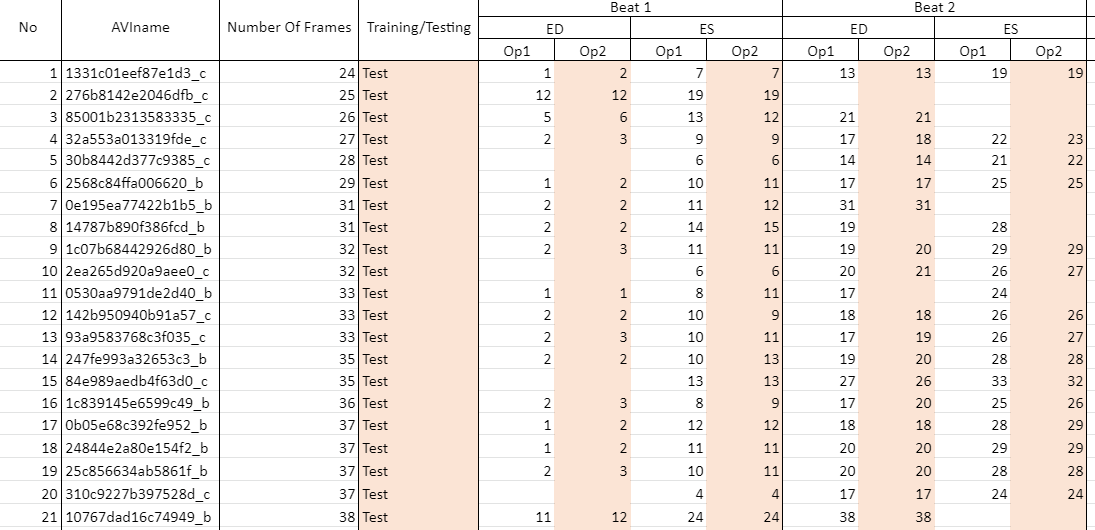
The image below shows a snapshot of the labels accompanying the dataset which you will receive once your access request has been accepted.
Op1 refers to operator 1, annotations from whom our network was trained/tested upon.
Op2 refers to operator 2, the second expert to annotate the dataset. Operator 2 annotations were used for testing and evaluation of observer variability only.
AVIname refers to the name of the avi file
Number Of Frames is the total number of frames in the video
Training/Testing refers to whether the video was used for training or testing only
Beats for ease of use, we have limited the number of beats in each video to 4. If you wish to have the unlimited beats label file, please specify when you request access to the dataset
Where there is no annotation in a cell, it means the first frame of interest is ES or the annotator did not select a frame
If you wish to request access, please complete the form below:
